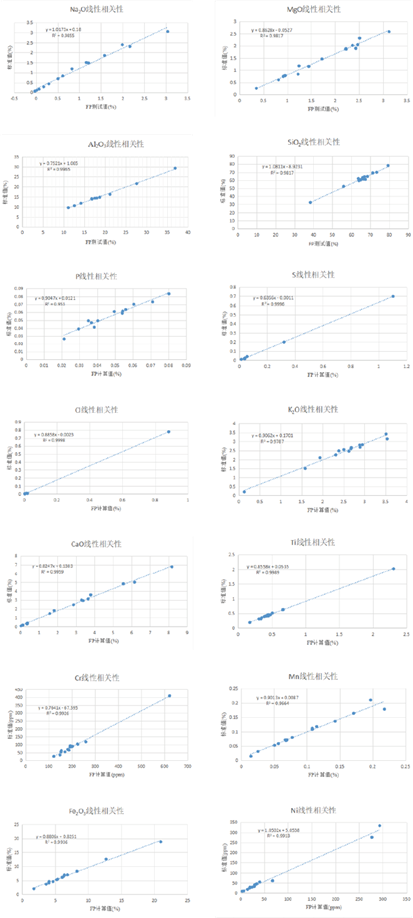
Table 3: Comparison of sulfur content in actual soil samples by combustion method and HS XRF
| Sample No |
20N3100003 |
20N3100006 |
20N3100015 |
20N3100016 |
20N2620009 |
20N2620023 |
20N2620031 |
20N2620038 |
20N2620040 |
20N2620042 |
20N2620047 |
| Combustion method test value |
0.26% |
0.88% |
0.25% |
0.66% |
0.17% |
0.16% |
0.13% |
0.12% |
0.11% |
0.18% |
0.13% |
| HS XRF test value |
0.27% |
0.92% |
0.27% |
0.65% |
0.17% |
0.16% |
0.12% |
0.11% |
0.12% |
0.19% |
0.13% |
| Relative deviation |
1.31% |
2.22% |
3.29% |
-0.53% |
1.46% |
0 |
-1.59% |
-3.93% |
2.18% |
0.54% |
0.39% |
Sample handling

Features and advantages

Stability
Stable analysis data can be obtained within 1 hour of startup, and it have excellent repeatability in continuous testing, day testing and long-term testing.

Accuracy
FP 2.0 eliminates the analysis error caused by the difference of sample matrix and spectral line interference through theoretical calculation, only a few standard (fixed value) samples are used to obtain accurate quantitative results.

Low consumption
There is need to consume gas, liquid nitrogen refrigeration, vacuum, etc., to achieve long-term operation with low failure rate.
 fast
fast
The nutrient content analysis of a soil sample can be completed in as little as 60 seconds.
 Extend
Scalable analysis of Na-Zn element content in various samples.
Original statement:
This article is the original work of ancoren company except for the quotation. If it is forwarded and quoted, the source must be indicated, otherwise it may involve infringement. For more detailed technical information, please consult the staff of Ancoren.


 Plant growth requires 17 elements which are carbon, hydrogen, oxygen, nitrogen, phosphorus, potassium, calcium, magnesium, sulfur, copper, iron, manganese, zinc, molybdenum, boron, chlorine, silicon. Among them, carbon, hydrogen, and oxygen come from air and water, and the rest are from the soil. Therefore, the main and trace elements in the soil are particularly important for the growth of plants. A variety of analytical methods are usually used to analyze elemental contents, including combustion iodometric method to measure sulfur content, atomic absorption spectrophotometry used to analyze potassium, calcium, magnesium, copper, iron, manganese, zinc and other metal elements, Kjeldahl nitrogen analyzer to analyze nitrogen content in soil, and plasma emission spectrometry. These methods require digestions of soil sample into solutions, which are complicated in sample processing, complicated in instrument operation, and low in efficiency.


