
overview
Coal is an important energy source in China, and the heat content of coal is one of the important indicators of coal quality. Carbon is the main combustible component in coal and the most basic component in coal, its content is about 35%~85%, hydrogen is the element with the highest heat content in coal, but the content is not much, in addition, the content of oxygen and sulphur in coal will also affect the heat content of coal. This method for the rapid analysis of the heat content of coal is based on the HS XRF detection of the heat content elements in coal.
The non-combustible minerals in coal form ash after combustion, which is an impurity in the coal. Ash tends to isolate combustible materials from the curing agent, making the coal less likely to burn adequately, while ash emissions can also pollute the environment, making accurate estimation of ash in coal of practical importance. This method further develops a mathematical model to analyse the ash content of coal by testing the mineral elements in coal.
The elements sulphur, chlorine and phosphorus in coal can bring air pollution emissions and corrode combustion furnaces, etc. They are harmful elements in coal. Monochromatic excitation X-ray fluorescence spectrometry is used for rapid and quantitative analysis of the elemental content of sulphur, chlorine and phosphorus.
The monochromatic excitation X-ray fluorescence spectroscopy with rapid basic parameter method significantly improves the accuracy of elemental analysis and achieves simultaneous rapid detection of multiple components (calorific value, total carbon, total sulphur, total chlorine, total phosphorus, arsenic, lead and ash) in coal by establishing advanced mathematical models, shortens the sample analysis cycle to within 20 minutes and provides a feasible rapid detection method for coal screening and utilisation.
Principle of the method
(1)Principle of monochromatic excitation X-ray fluorescence spectrometry
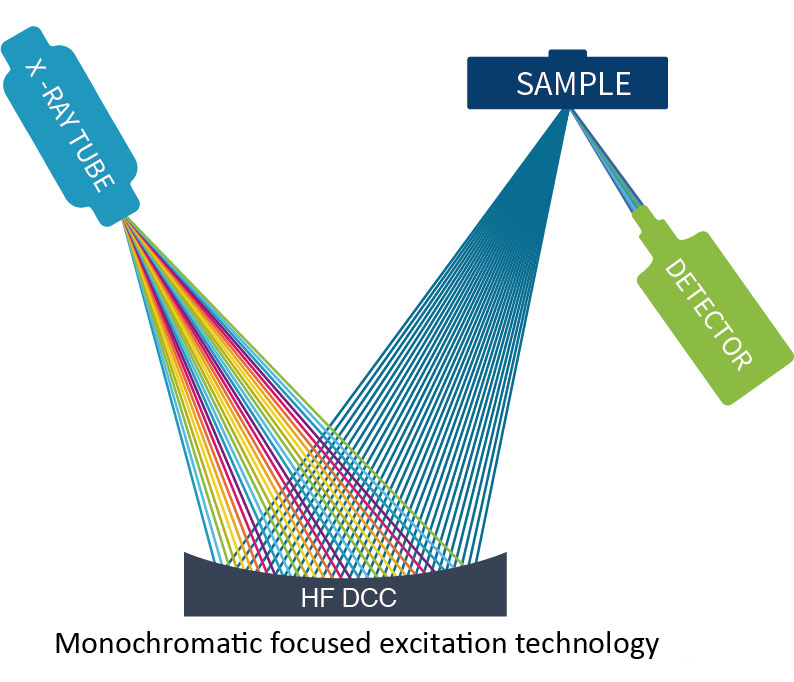
The monochromatic excitation X-ray fluorescence spectrometer (HS XRF) uses a fully focused hyperbolic crystal bending technique to focus the diffraction of the target material in the X-ray tube emission spectrum to a single point of the sample, significantly reducing or eliminating the interference of the continuous scattered ray background in the X-ray tube emission spectrum on the sample elemental spectrum, improving the signal-to-noise ratio of elemental detection, and reducing the detection limit by 1-2 orders of magnitude compared to traditional XRF. The monochromatic excitation X-ray fluorescence spectrometer enables the detection and analysis of trace and trace elements.
(2)Fast Fundamental Parameter Method
The Fundamental Parameter (FP) method is an important technique for quantitative XRF analysis, which establishes a library of fundamental parameters and mathematical models for the physical phenomena defined by X-ray fluorescence physics, and directly obtains the content of each element in the sample after extensive calculations, solving the complexity and uncertainty of quantitative analysis due to XRF matrix effects, inter-element absorption enhancement effects, spectral overlap interference and various detector effects, and achieving This enables quantitative analysis of sample elements in the absence of a standard sample. The Fast FP method developed by Beijing Ancoren is a comprehensive fundamental parameter method, leading the way in terms of sample adaptability, quantitative accuracy and scalability.
(3)Mathematical modeling of coal fractions
The content of carbon (C) and metal elements in coal obtained by monochromatic excitation X-ray fluorescence spectrometry (HS XRF) provides reliable data for the development of a mathematical model of coal heat and ash content.
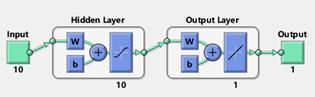
The coal industry component calculation model uses feed-forward neural networks (BP Networks) and least squares to obtain elemental content and spectral information by scanning a large number of samples, performing principal component analysis (PCA) on the large amount of information to obtain valid variables, and then performing machine learning to obtain a highly accurate mathematical model with a goodness of fit (R²) of 0.99 or better.
The coal industry component calculation model is deeply integrated with the Fast FP algorithm using a database, which is highly scalable and allows the algorithm to learn for different coal types, extending its range of adaptation.
Performance data
(1) Comparison of standard sample tests
Monochromatic excitation X-ray fluorescence spectrometer tests were carried out on standard samples of coal components and the results are shown in the table below.
①Total carbon and sulphur
The standard sample test data are shown below.
Table 1 Summary of accuracy of elemental carbon (C) and sulphur (S) content of specimens
| Sample name |
C(%) |
S(%) |
| Standard values |
Test values |
Absolute error |
Standard values |
Test values |
Absolute error |
| GBW11139 |
57.2 |
58.71 |
1.51 |
0.6 |
0.778 |
0.178 |
| GBW11140 |
35.16 |
35.31 |
0.15 |
0.48 |
0.658 |
0.178 |
| GBW11141 |
74.6 |
77.13 |
2.53 |
0.3 |
0.36 |
0.06 |
| GBW11142 |
80.52 |
81.83 |
1.31 |
1.17 |
1.011 |
-0.159 |
| GBW11143 |
77.46 |
76.33 |
-1.13 |
2.55 |
3.079 |
0.529 |
| GBW11144 |
75.8 |
75.48 |
-0.32 |
2.62 |
2.854 |
0.234 |
| GBW11145 |
63.32 |
61.76 |
-1.56 |
1.47 |
1.503 |
0.033 |
| GBW11146 |
69.8 |
67.03 |
-2.77 |
2.12 |
2.375 |
0.255 |
| GBW11147 |
58 |
64.1 |
6.1 |
2.01 |
1.573 |
-0.437 |
| GBW11149 |
75.53 |
68.91 |
-6.62 |
0.35 |
0.442 |
0.092 |
| GBW11150 |
69.8 |
70.62 |
0.82 |
3.06 |
2.761 |
-0.299 |
| GBW11151 |
54 |
54.34 |
0.34 |
1.18 |
0.966 |
-0.214 |
| GBW11152 |
62.6 |
67.11 |
4.51 |
3.25 |
2.728 |
-0.522 |
| GBW11153 |
71.37 |
68.56 |
-2.81 |
0.45 |
0.506 |
0.056 |
| GBW11154 |
60.34 |
58.89 |
-1.45 |
0.32 |
0.335 |
0.015 |
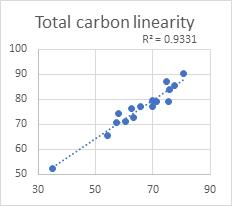
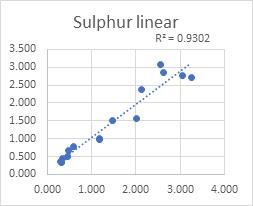 Figure 1 Linear plot of total carbon (C) Figure 2 Linear plot of sulphur (S) fraction
②Ash and heat content
Figure 1 Linear plot of total carbon (C) Figure 2 Linear plot of sulphur (S) fraction
②Ash and heat content
The monochromatic excitation X-ray fluorescence spectrometer was used to determine mineral elements (MgO, Al2 O3 , SiO2 , K2 O, CaO, TiO2 , Mn, Fe2 O3 ) and heat generating elements such as carbon (C) and sulphur (S) in coal, and to establish mathematical models by learning from a large number of fixed value samples through neural networks to obtain reliable results of ash and heat generation tests in coal.
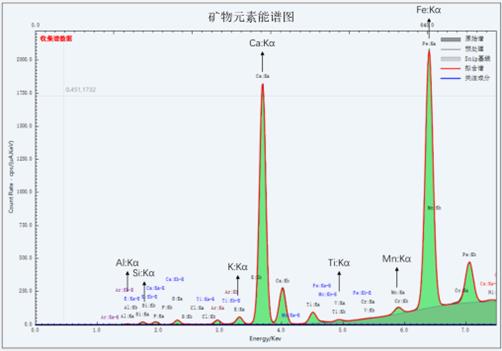
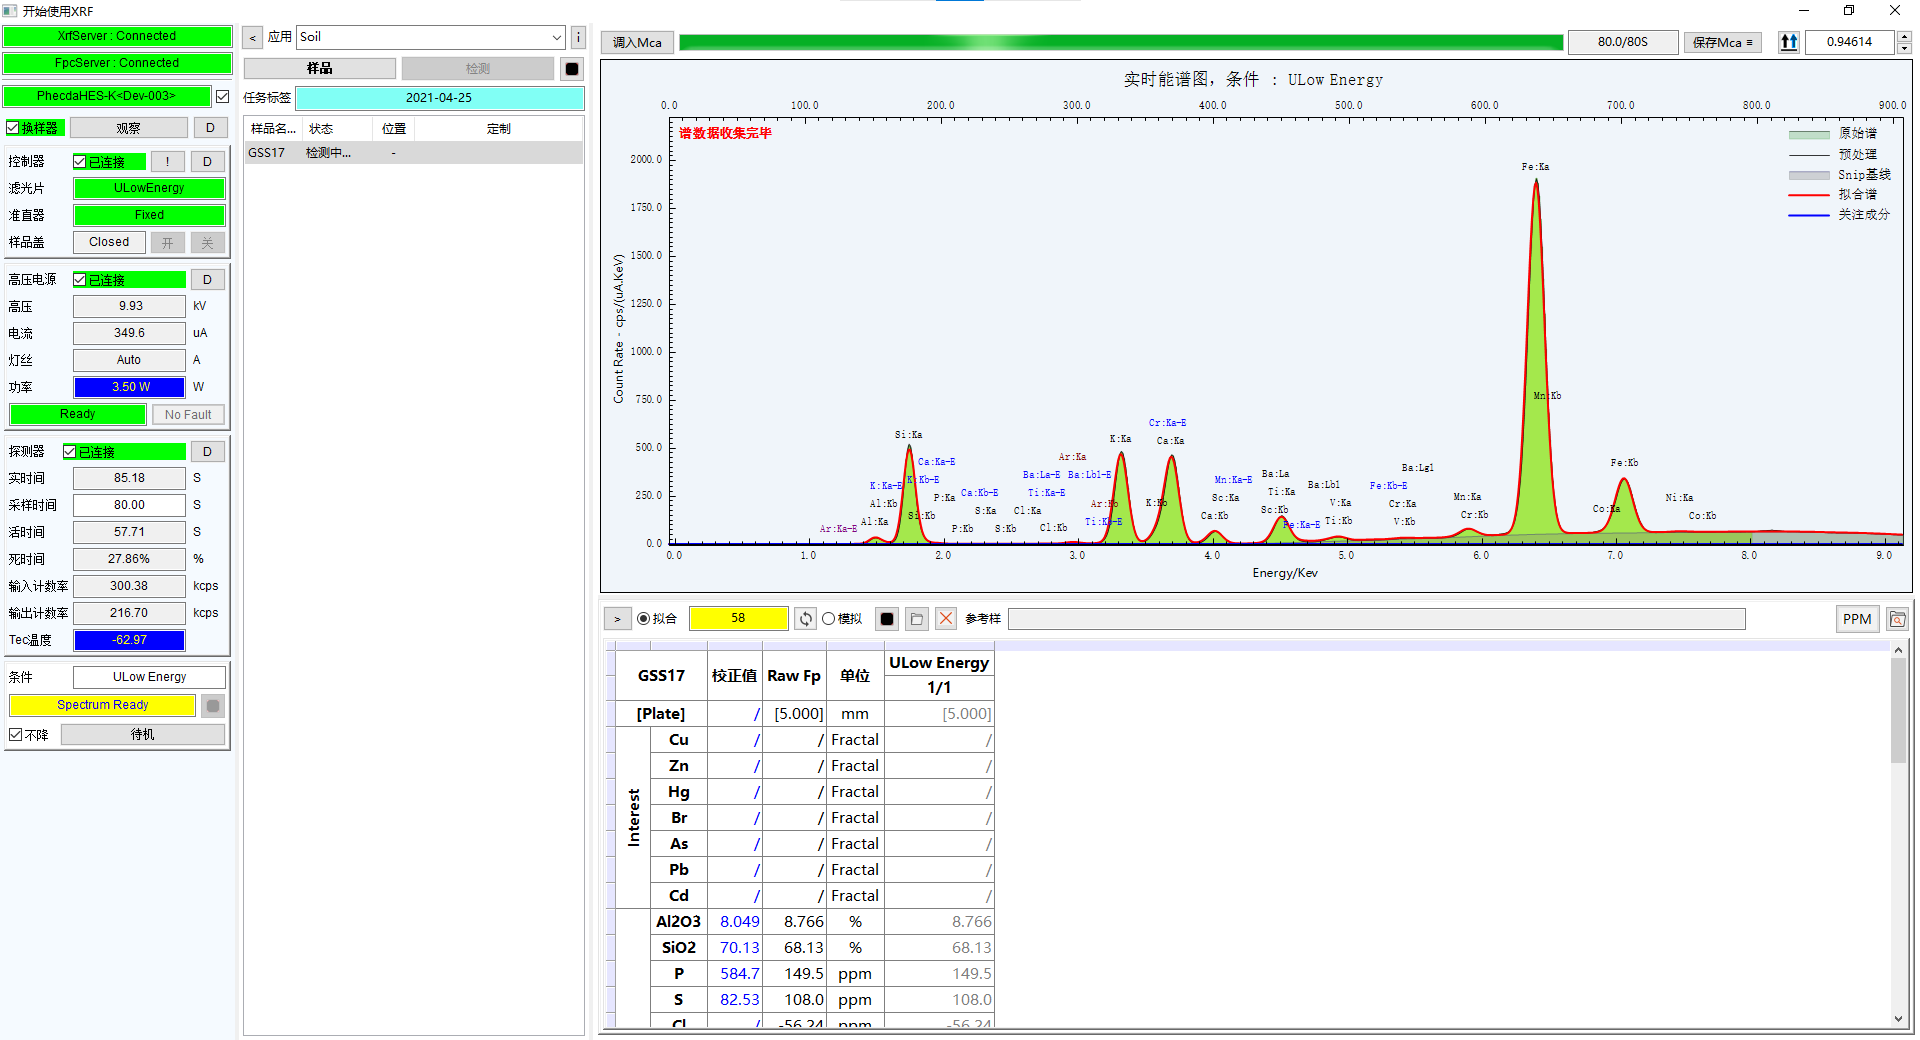
Figure 3 Mineral element energy spectrum
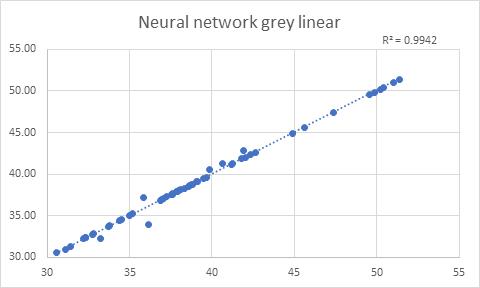
Fig. 4 Neural network calculates the linearity of the grey score
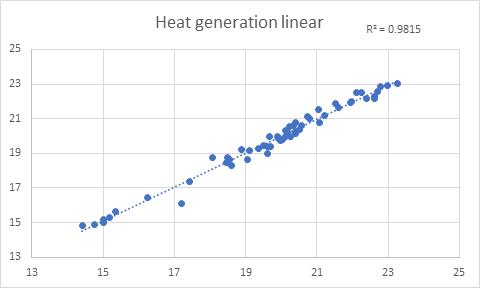
Figure 5 Heat generation linearity
③Trace elements in coal
Table 2 Trace element accuracy of standard samples
| Sample name |
Co(ppm) |
Ni(ppm) |
Cu(ppm) |
| Standard values |
Test values |
Absolute error |
Standard values |
Test values |
Absolute error |
Standard values |
Test values |
Absolute error |
| GBW11156 |
3.6±0.4 |
3.399 |
-0.201 |
8.2±0.8 |
8.889 |
0.689 |
10±1.2 |
13.65 |
3.649 |
| GBW11157 |
1.5±0.2 |
2.242 |
0.742 |
4.1±0.5 |
4.293 |
0.193 |
9.4±0.9 |
9.314 |
-0.086 |
| GBW11158 |
3.6±0.3 |
2.561 |
-1.039 |
8.1±0.8 |
6.392 |
-1.708 |
4.7±0.4 |
4.780 |
0.080 |
| GBW11159 |
9.2±1 |
9.144 |
-0.056 |
37±4 |
36.86 |
-0.137 |
11±1 |
11.26 |
0.256 |
| GBW11160 |
3.4±0.4 |
3.955 |
0.555 |
8.4±0.9 |
9.364 |
0.964 |
10.1±1.2 |
9.850 |
-0.250 |
Continued Table 2 Trace element accuracy of standard samples
| Sample name |
Pb(ppm) |
Mo(ppm) |
Sb(ppm) |
| Standard values |
Test values |
Absolute error |
Standard values |
Test values |
Absolute error |
Standard values |
Test values |
Absolute error |
| GBW11156 |
20±3 |
18.77 |
-1.229 |
2.7±0.4 |
2.561 |
-0.139 |
0.41±0.05 |
0.397 |
-0.013 |
| GBW11157 |
13.9±1.2 |
12.25 |
-1.654 |
2.1±0.2 |
1.477 |
-0.623 |
0.37±0.05 |
0.565 |
0.195 |
| GBW11158 |
4.2±0.5 |
8.506 |
4.306 |
0.61±0.08 |
1.453 |
0.843 |
0.76±0.06 |
0.788 |
0.028 |
| GBW11159 |
20.2±1.6 |
21.97 |
1.775 |
2.4±0.4 |
2.486 |
0.086 |
1.02±0.11 |
0.889 |
-0.131 |
| GBW11160 |
13.3±1.1 |
10.10 |
-3.198 |
1.14±0.18 |
0.973 |
-0.167 |
0.22±0.03 |
0.140 |
-0.080 |
Continued Table 2 Trace element accuracy of standard samples
| Sample name |
Th (ppm) |
Cd(ppm) |
Se (ppm) |
| Standard values |
Test values |
Absolute error |
Standard values |
Test values |
Absolute error |
Standard values |
Test values |
Absolute error |
| GBW11156 |
9.5±0.9 |
10.70 |
1.196 |
0.058±0.008 |
0.0977 |
0.040 |
4.2±0.3 |
4.332 |
0.132 |
| GBW11157 |
8.8±0.7 |
6.754 |
-2.046 |
0.086±0.007 |
0.0123 |
-0.074 |
3.4±0.3 |
3.500 |
0.100 |
| GBW11158 |
1.62±0.21 |
3.467 |
1.847 |
0.019±0.004 |
0.0635 |
0.045 |
0.93±0.11 |
0.930 |
0.000 |
| GBW11159 |
9.5±0.9 |
9.445 |
-0.055 |
0.34±0.05 |
0.211 |
-0.129 |
4.2±0.3 |
3.964 |
-0.236 |
| GBW11160 |
6.1±0.6 |
5.158 |
-0.942 |
0.062±0.009 |
0.181 |
0.119 |
3.3±0.4 |
3.303 |
0.003 |
(2) Actual samples
The results of simultaneous multi-component testing of coal samples by monochromatic excitation X-ray fluorescence spectrometry (HS XRF) are shown in the table below.
Table 3 Accuracy of calculated values of ash and calorific value of actual samples
| Sample Serial Number |
Ash scale values |
Calculated ash values |
Relative deviation |
Calorific value |
Calculated heat generation values |
Relative deviation |
| 1# |
38.64 |
38.53 |
-0.29% |
19.67 |
20.1 |
2.16% |
| 2# |
36.96 |
37.43 |
1.27% |
20.52 |
20.3 |
-0.95% |
| 3# |
39.64 |
39.05 |
-1.48% |
19.5 |
19.8 |
1.68% |
| 4# |
34.49 |
34.55 |
0.18% |
21.06 |
21.5 |
2.22% |
| 5# |
30.55 |
30.91 |
1.17% |
23.25 |
22.9 |
-1.46% |
| 6# |
32.81 |
32.26 |
-1.67% |
22.12 |
22.5 |
1.90% |
| 7# |
36.85 |
36.92 |
0.20% |
20.34 |
20.6 |
1.10% |
| 8# |
37.6 |
38.14 |
1.44% |
20.27 |
20.1 |
-1.09% |
| 9# |
35.19 |
35.59 |
1.13% |
21.22 |
21.1 |
-0.35% |
| 10# |
32.32 |
32.13 |
-0.60% |
22.69 |
22.5 |
-0.77% |
| 11# |
32.31 |
33.09 |
2.43% |
22.62 |
22.2 |
-1.75% |
| 12# |
39.82 |
40.03 |
0.53% |
19.37 |
19.3 |
-0.57% |
| 13# |
37.26 |
36.16 |
-2.95% |
20.4 |
20.8 |
1.90% |
| 14# |
37.53 |
37.77 |
0.63% |
20.4 |
20 |
-2.01% |
| 15# |
36.14 |
35.14 |
-2.78% |
20.74 |
21.1 |
1.67% |
| 16# |
37.89 |
38.58 |
1.81% |
20.02 |
19.9 |
-0.77% |
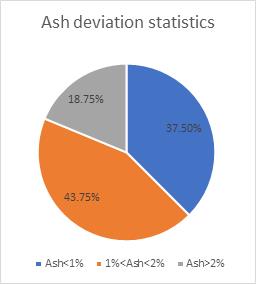
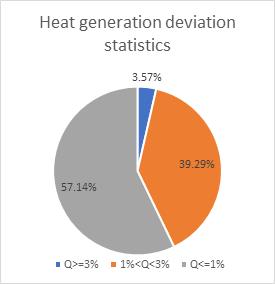 Figure 7 Ash and calorific deviation statistics
Feature advantages
 Accurate quantification
The monochromatic excitation X-ray fluorescence spectrometer PHECDA series can meet the requirements for rapid testing of coal heat and ash with an absolute deviation of 200 Cal/g for over 95% of samples and a relative deviation of 3% or less for over 95% of samples.
 Quick analysis
It takes only 5 minutes to test a coal sample for ash, sulphur and trace elements, and after the national standard method of testing to obtain the analytical water Mad , the high level heat content of the air dryer can be measured.
 Elimination of disturbances
The Fast FP algorithm is ultra-adaptive compared to the traditional empirical coefficient method and can automatically fit the sample background signal, deduct noise, eliminate mineral effect interference and reduce errors.
 Easy to operate
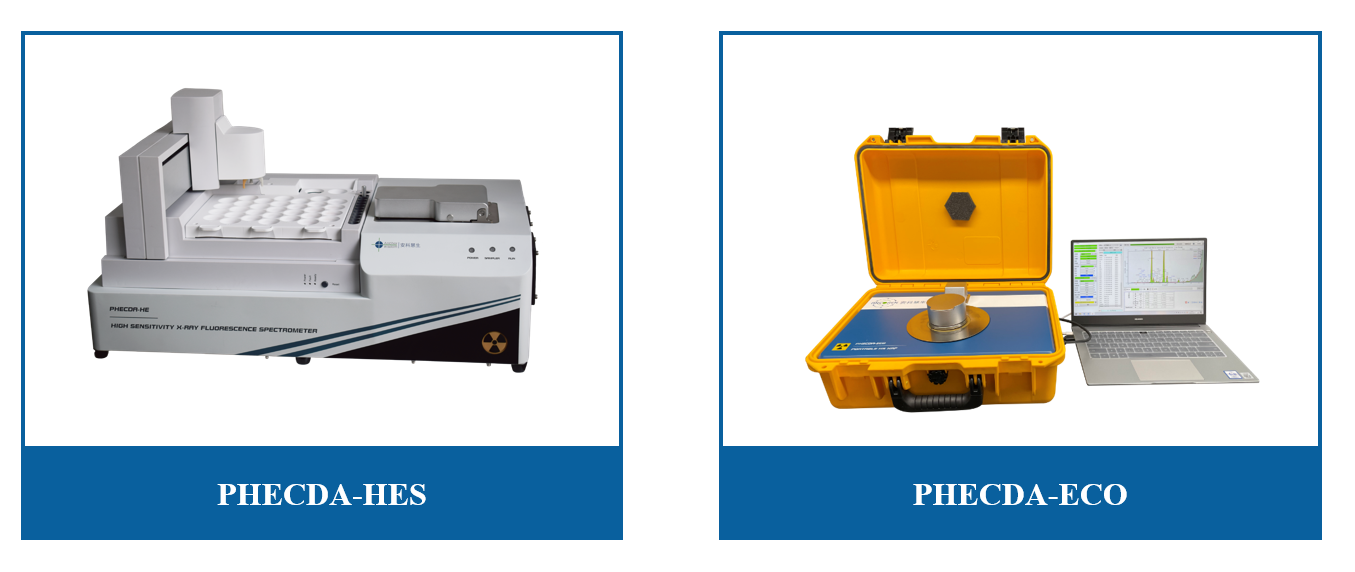
The PHECDA-HES model is equipped with automatic sample injection and can automatically test up to 30 samples continuously.
Original statement:
This article is the original work of ancoren company except for the quotation. If it is forwarded and quoted, the source must be indicated, otherwise it may involve infringement. For more detailed technical information, please consult the staff of Ancoren.