-
• Empirical Coefficient method
In X-ray fluorescence analysis, the absorption and enhancement effects between elements often make the relationship between the elementalcontent and the net intensity of the fluorescence spectrum very complex and non-linear, but a rough linear relationship, which requires plenty of standard samples to establish a multivariate nonlinear regression analysis model. This is what we call empirical coefficient method and a common method in X-ray fluorescence analysis.
The Empirical Coefficient method is a simple and reliable method if matric composition of reference materials used as calibration standards correspond to that of the sample under study. However, when the matrix changes a lot, the applications must be obtained by using a certain number of non-correlated standard samples and applying an appropriate matrix correction model.
Considering the complexity of the effects between elements, it is often difficult to find an accurate and general model, which limits the extension of the empirical coefficient method. Therefore, the matrix of the sample to be tested to be basically consistent with that of the calibrates, The range of variation is not too large, the standard samples should be enough so that the range of the content covers the range of variation of the actual samples, additionally, the correlation between the elements should not be too strong, so it is very difficult to find these target standard samples, even though, the coefficients obtained through mathematical modeling can’t reflect the absorption-enhancement effect between the elements exactly. It often leads that the calibration curve looks good but the test deviations of actual samples are relatively large.Because of the incorrect mathematical model, the standards which cannot represent some absorption enhancement effects, and the test content exceeding the standards coverage,any one of them may cause those problems. Even that there were a series of standard samples meeting the conditions and a method model is accurately executed, The interference spectrum, the escape peaks caused by the detector, and the sum-peaks, etc. those impacts on the net strength calculation have not been countted.
The nature of the empirical coefficient method determines those difficulties. If multi-layer coatings and film thickness detection are added, the effect of matric will be more complicated, and the difficulty of modeling will significantly increase, besides the common problem that it is harder to get the standard samples.
• Fast Fundamental Parameter method (FP)
From the occurrence of X-rays, the filtering treatment of primary X-rays, and the interaction between X-rays and samples (fluorescence and scattering effects), to the response mechanism of X-ray detectors, there weremature physical theories and comprehensive databases.
All links from the occurrence to the detection of the spectrums will be calculated in FP, which includes the X-ray tube's emission spectrum (target characteristic spectrum and continuous spectrum). incident spectrum after the filter Or monochromator entering into the sample, various matrix effects (matrix absorption effects, secondary fluorescence of coexisting elements), scattering effects (Rayleigh scattering and Compton scattering) on the sample, as well as effects (efficiency, escape peaks (fluorescence escape and Compton scattering escape), pulse accumulation, etc.) that occurred after the detector received X-rays emitted from the sample. In brief, the spectrum of the FP calculated is consistent with the actual spectrum measured with the detector.
The Iteration which takes the element content as the unknown parameter, with adjusting the content to minimize the error between the calculated spectrum and the measured spectrum is the main process in FP. A large number of experiments have proved that the quasi-quantitative value has a deviation from the actual value (normally, it is very small). However, it has an excellent linear relationship with the actual value, so we can use a few standard samples to correct the deviations due to calculations or system hardware, achieving the purpose of accurate quantification.
Why is the algorithm called Fast FP in our products?
As we all know, it need calculate the entire process of X-rays by FP, in which a lot of numerical integration and iterative arithmetic that cannot be completed by a single machine were involved. In fact, we have reduced the calculation time significantly by optimizing program design already, the single calculation time is as low as several hundred milliseconds.
• Example of soil application using Fast FP
1. Forward calculation
Detecting a sample with a certain content, then the calculated spectrum is highly consistent with the spectrum collected by the detector, which guarantees the correctness of FP .
2. Inverse fitting
The reverse iteration is aimed at unknown samples, and the value of content is obtained by iterative calculation. The flowchart is as follows:
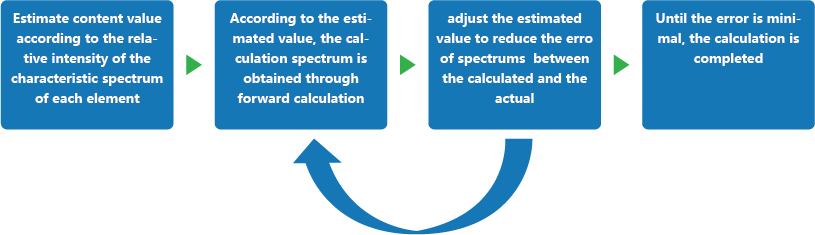
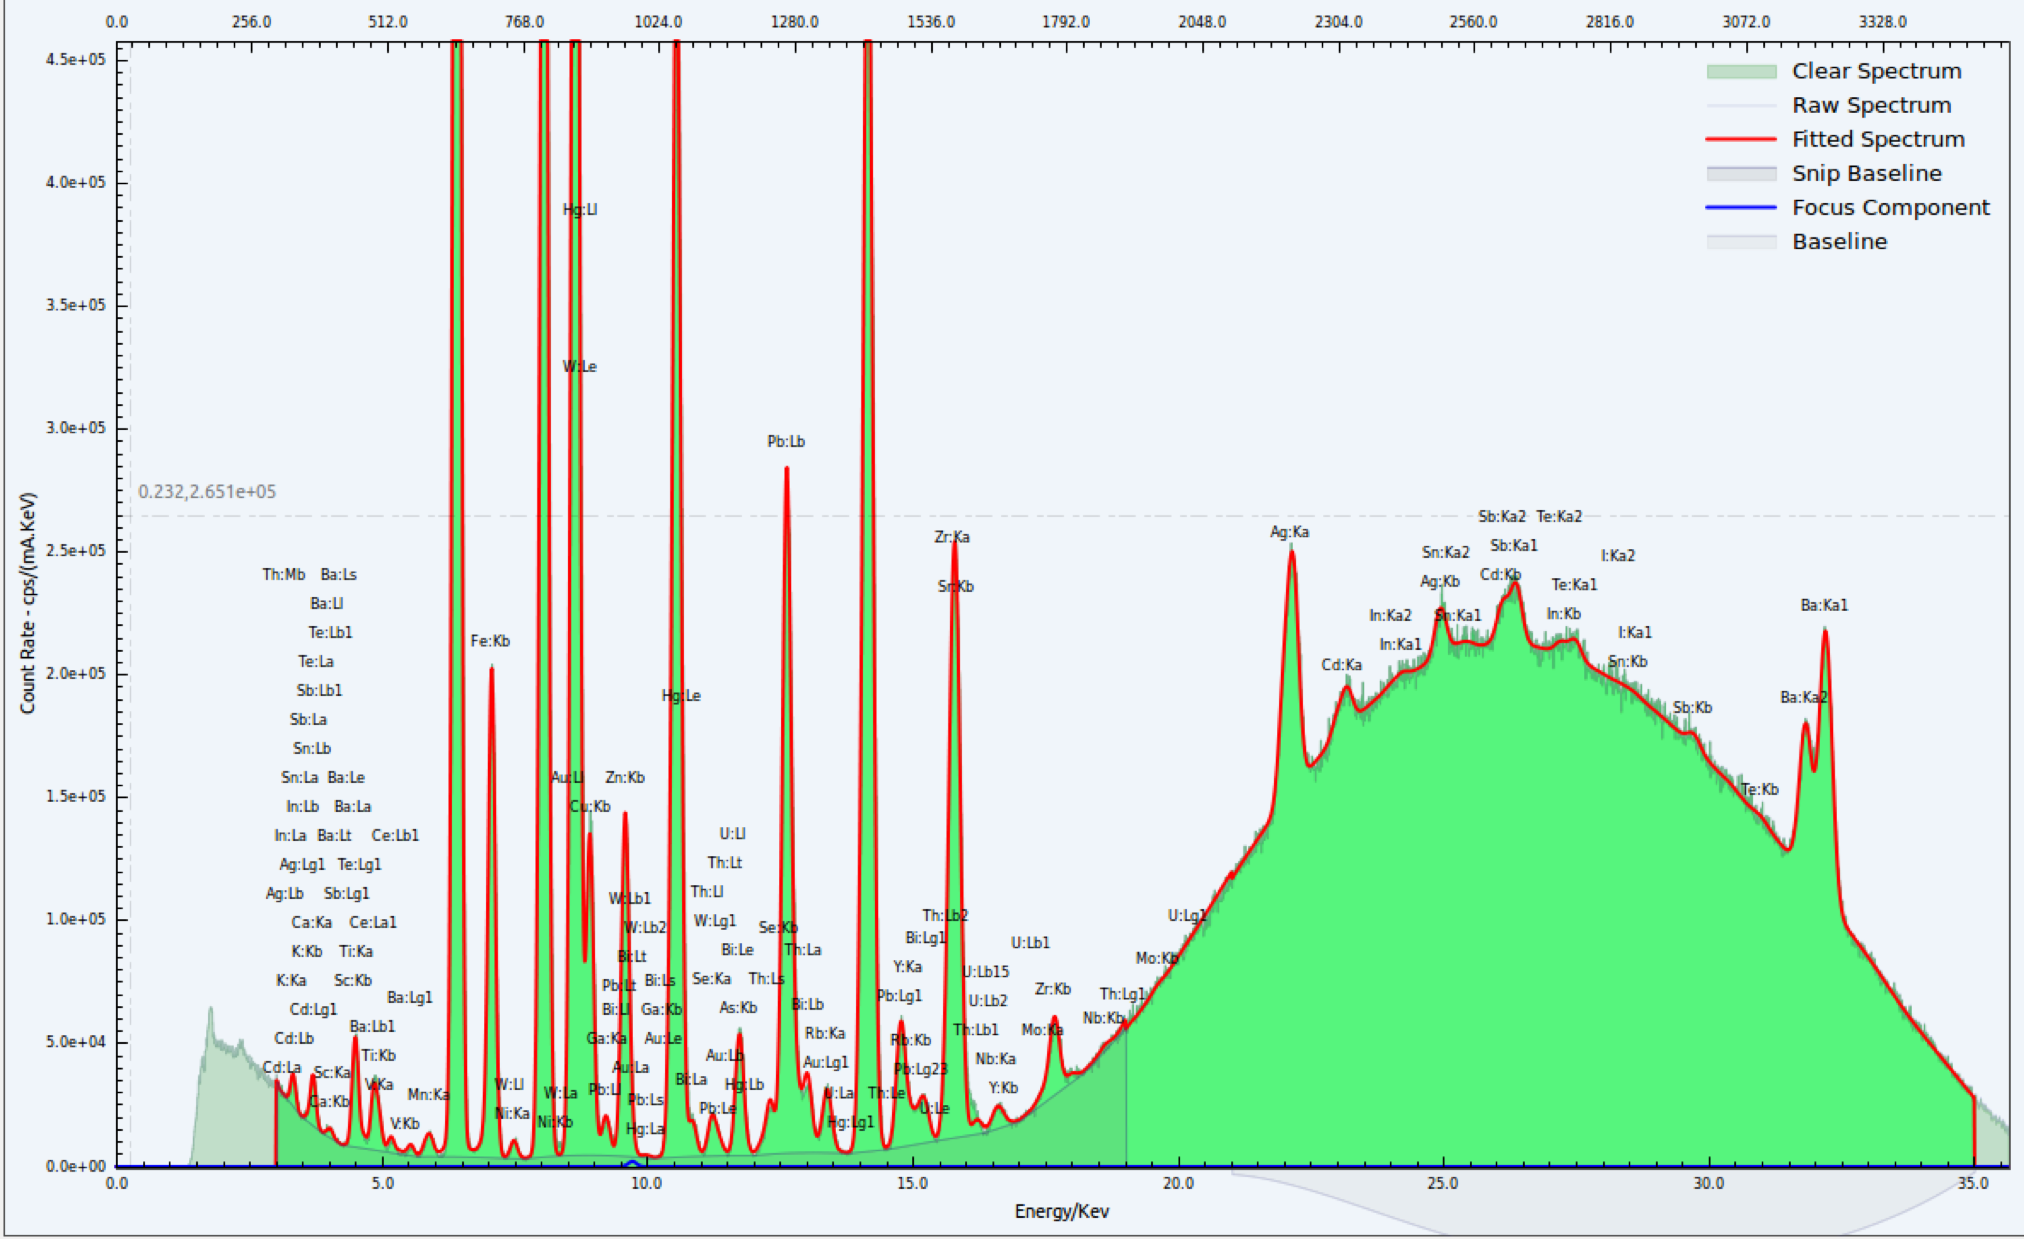
Fig2. Fitting of Computed Spectrum and Detector Acquisition Spectrum
Figure 2 shows the fitting of the spectrum during the test. It can be seen from the figure that the peaks fit well and the background is accurately subtracted, which ensures the reliability of quasi-quantitative value calculated by FP.
3. Accurate quantitation
The test is performed on 40 soil standard samples (GSS and GSD series), and the focus is to observe whether the certified values of Cr, As, Ni, Cu, Zn, Cd and the calculated values of FP satisfy a good linear relationship. The results are shown in the figure 3, in whichthe correlation coefficients of Cr, As, Pb, Cu, Zn, Ni, and Cd are greater than 0.98, indicating the accuracy and strong adaptability of the application by using FP at soil heavy metal detection.

Fig 3. Linear relationship between the certified value and calculated value of FP
The goodlinear correlation, on the one hand, shows that the Fast FP correctly calculated the matrix effect, spectrum interference, background interference, detector effect, etc. on the other hand, illustrates that calibration with few standards can be achieved.
The advantages of using FP are obvious. Because that almost all the effects of X-ray fluorescence occurring at various stages were considered in the calculation, there is no need to calibrate the matrix with a factor of influence whose physical meaning is ambiguous sometimes, so the reliability of the results is exceedingly guaranteed.
1、The element compositions (and / or coating thickness) of the samples can be quantified to certain extent even without the standard samples.
2、A high accuracy of quantitation can be achieved for quite a few applications
3、For some applications where the standard samples are difficult to obtain, FP is almost the only quantitative approach.
4、Higher accuracy can be obtained by using a few standard samples to correct the system error.
5、The application range is wide so that high accuracy can be obtained from trace to constant content.
6、The Fast FP is a good tool for quantitative analysis in the application of some nonstandard methods or difficult sample treatment
7、Elemental qualitative and quantitative analysis based on FP is a key in establishing big data applications, such as product traceability.
8、Calculation time were significantly reduced by Fast FP.
Application field Solution Environmental Protection Analysis of inorganic elements content in agricultural and construction soil HMET + HS XRF combined for emergency monitoring of heavy metals in environmental water quality Detection of heavy metals in solid waste PM2.5 inorganic element content analysis and data traceability Food Safety Rapid determination of heavy metals in food: X-ray fluorescence based on FP Detection of heavy metals in traditional Chinese medicine : HS XRF with Fast FP Heavy metal content detection in cosmetics—high sensitivity XRF heavy metal analyzer Geology and Minerals Analysis of elemental content of various ore by HS XRF and Fast FP Rapid detection of rare earth element content Others Analysis of heavy metal content in cement kiln co-processing Analysis of metal element content in petrochemical products
- HOME
-
PRODUCT
- SOLUTION
-
- ENVIRONMENTAL PROTECTION
- Real-time monitoring solutions for heavy metal emissions in air and water
- Detection of heavy metal content in soil environment
- Simultaneous determination of solid waste (S, Cl, F)
- Analysis of soil nutrient content
- Detection of toxic elements in solid waste and hazardous waste
- Emergency monitoring of Heavy Metals in Environmental water quality
- PM2.5 air filter membrane inorganic element content analysis
-
- METALLIC ORE
- Cu/Cr/Ni/Mn Ore Element Content Detection
- Elemental content analysis of Copper concentrates
- High purity metal (alloy) content analysis
- Elemental content analysis of slag samples
- Rapid determination of precious metal content in ternary catalyst
- Determination of element content in magnesite and magnesite
- Rapid analysis of rare earth elements content
- Rapid trace precious metal content testing
- XRF LIBRARY
- SERVICE&SUPPORT
- ABOUT ANCOREN